rayban-meta-data-analysis
Visualizations
This folder contains all visual representation files generated from the cleaned data for the Ray-Ban Meta smart glasses project.
Purpose
- To provide graphical insights into sales trends, growth patterns, and market share distribution.
- To support the analysis through clear and informative charts and graphs.
- To facilitate communication of data-driven findings to stakeholders.
Contents
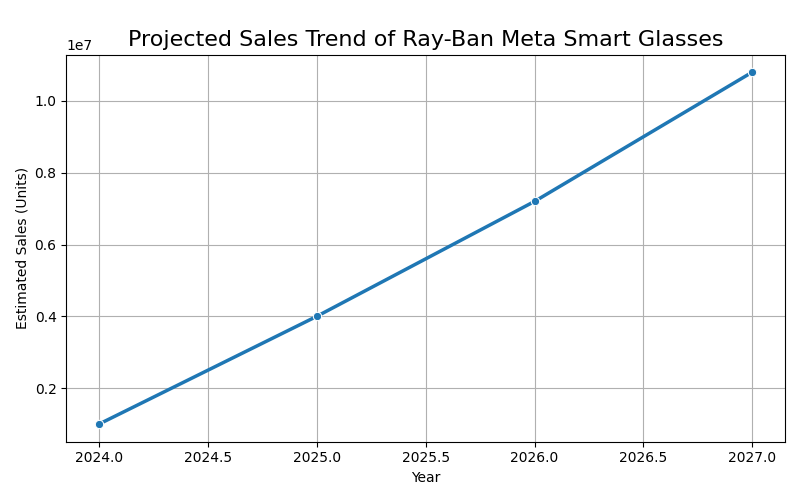
- Line_Chart/: Line charts illustrating sales trends over time.
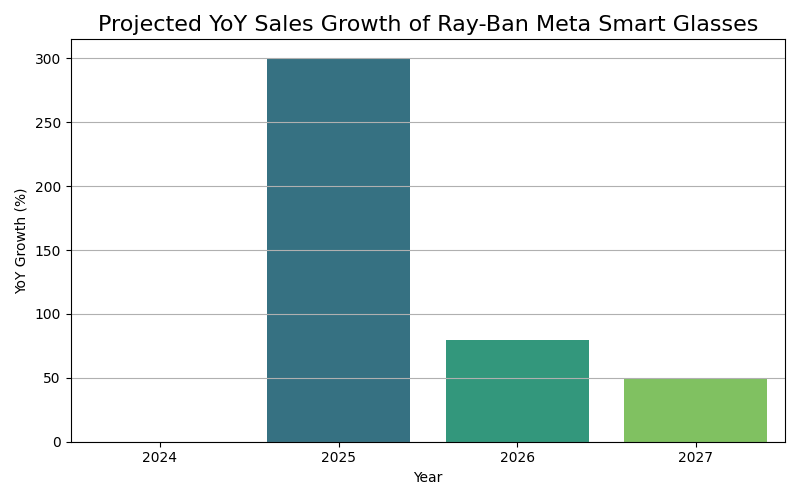
- Bar_Chart/: Bar charts showing year-over-year (YoY) growth percentages.
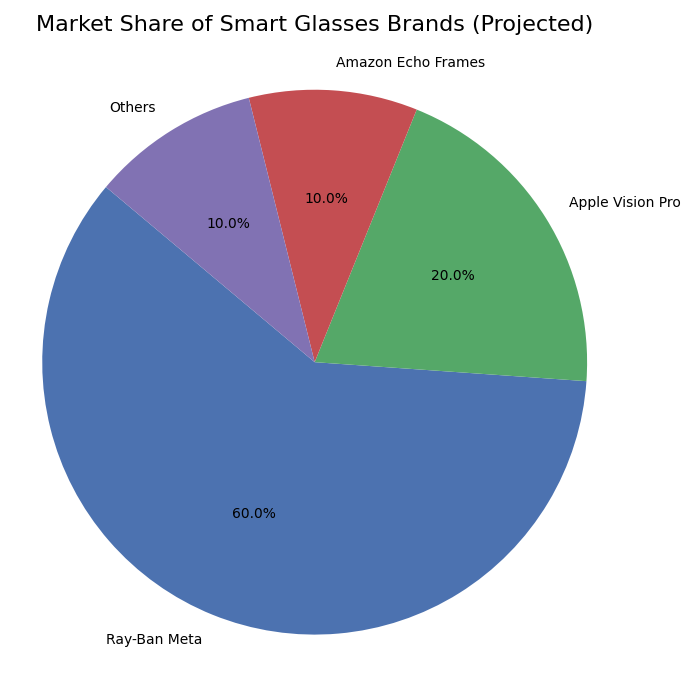
- Pie_Chart/: Pie charts depicting market share breakdown among competitors.
- README.md: This document describing the folder’s purpose and structure.
Notes
- All visualization files are saved in PNG format.
- File naming conventions follow the chart type and content for easy identification.
- Visualizations are generated using Python libraries such as Matplotlib and Seaborn.
1️⃣ YoY Sales Growth (Bar Chart)
2️⃣ Market Share Breakdown (Pie Chart)
3️⃣ Sales Trend Over Time (Line Chart)
Keeping the visualizations well-organized ensures effective presentation and easier updates for future analyses.